

Our CI Pipeline
At Glean, the CI (Continuous Integration) pipeline for our core web app does quite a lot, including:
- Running unit tests for the frontend and backend services
- Building all the corresponding artifacts and publishing them as Docker images
- Deploying these images into a Kubernetes cluster and ensuring they’re serving traffic ok
- Running “end-to-end” tests against the resulting environment via Cypress
This gives us a great level of confidence when we’re developing Glean, but doing all of these things also increases our risk of the pipeline becoming too slow or flakey to be anything other than an immense source of frustration for developers.
How we’ve dealt with it
As the codebase and pipeline have grown and matured, we’ve found the need to keep returning to it now and then in concentrated bursts of effort to keep it healthy. We were doing this on a fairly ad-hoc basis - pretty much when enough complaints bubbled to the surface for us to feel that the pipeline had become “too painful” again, which was usually much later than we would ideally have spotted the underlying issues.
After the latest batch of fixes, we began to think about how we might collect meaningful data on this flakiness so we weren’t just fixing in the dark all the time. What would an acceptable percentage of build flakes be for us? What about average build times? And so our “CI Monitor” was born.
How it works
The first question we needed to answer was: how do we measure flakiness?
Clearly it can’t be as crude as the number of failures across all branches, because this will include a bunch of failures on branches that had actual problems with them.
We could restrict it to looking at just the failure rate of main, but this would also be imperfect - we’d still get some noise from the occasional bad merge, and we also wouldn’t get a particularly large sample size over the course of a normal week.
Instead of the above approaches, we decided to create a dedicated ci-monitor branch, which would build on a cron schedule throughout the week to give us lots of juicy data. It was a simple tweak to our Jenkinsfile to set up the cron behaviour:
String cron_str = BRANCH_NAME == "ci-monitor" ? "*/20 8-17 * * 1,2,3,4" : ""
pipeline {
   triggers {
       // Every 20 minutes from 8-5pm mon-thurs for the CI monitor
       cron(cron_str)
   }
Next, we introduced a git tag called latest, to be applied to the Glean repository whenever a build of main passes. This essentially marks the last stable commit, which the ci-monitor can safely update itself from without worrying about bad merges. The bash responsible for creating and updating the branch is below, which we have running in a Github Actions workflow:
git fetch origin refs/tags/latest:refs/tags/latest
git checkout ci-monitor 2>/dev/null || git checkout -b ci-monitor
git reset --hard latest
git push --set-upstream origin ci-monitor -f
We have another Github Actions job that runs on a Friday evening to delete the branch, which allows some automated cleanup to clear stuff down from the week’s build - published Docker images, AWS (Amazon Web Services) resources and the like.
Now we had our guinea pig branch, the next step was to get the raw stats somewhere that could be processed. We ended up using Prometheus for this (specifically, a fork of https://github.com/lovoo/jenkins_exporter), capturing simple stats about each build including the duration, pass/fail status and the stage it failed on if applicable.
Finally, it was over to Python to knock together some simple code to process the data each week and post it into Slack. I’ve included some snippets of this below to give the general idea:
def get_build_results() -> List[BuildResult]:
   full_query = f'jenkins_job_last_successful_build_duration_seconds[5d]'
   raw_builds = run_prometheus_query(full_query)
   return [BuildResult(success, build) for build in raw_builds)]
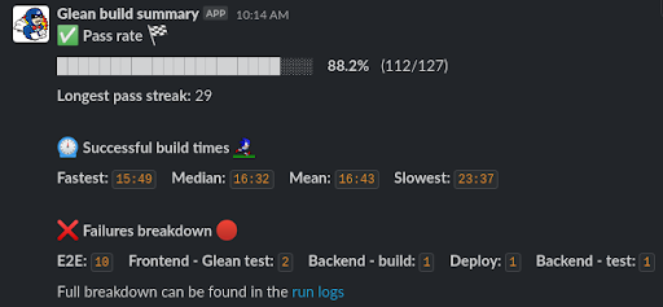
slack_message = ":white_check_mark: *Pass rate* :checkered_flag:\n\n"
slack_message += f"{progress_bar}    *{formatted_percent}*   ({len(success_builds)}/{build_count})\n\n"
slack_message += f"*Longest pass streak:* {longest_pass_streak}"
send_slack(slack_message, 'https://hooks.slack.com/services/foo/bar/baz')
How it’s going
And that’s it! The team now gets a weekly message in Slack with reliable data on how our Glean pipeline is faring. If we see the pass rate or build times start to worsen, we can nip it in the bud by taking a look at the failed builds and fixing up anything that’s regressed.
Could you be our next dev?
At Team Glean, we're always on the lookout for talented people to join us.
To learn more about working with us, and to see the latest opportunities, follow the link below!
Share this blog


Time for a simpler, smarter note taking accommodation?